Linear Fit
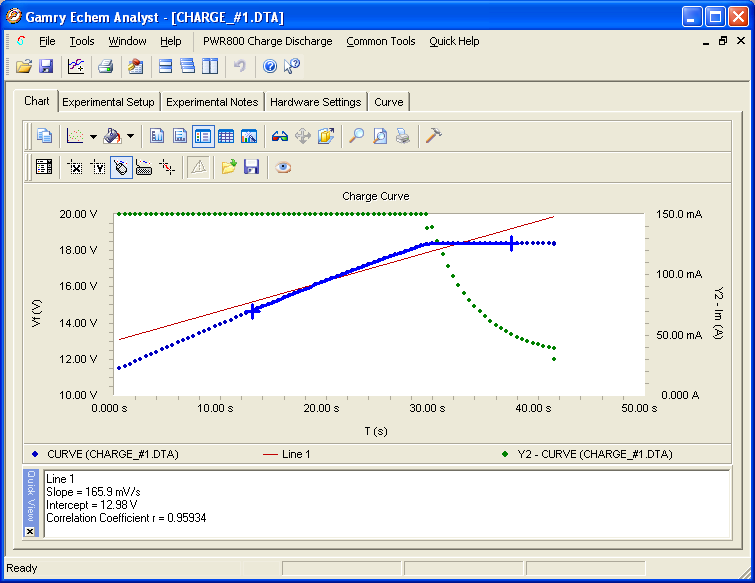
The Linear Fit command performs a linear least-squares fit on a user-defined region of data, and adds the resulting line as a trace on the chart. This line can then be used as a baseline for certain types of calculations, such as Peak Height. In order to use this command, a region must be specified on the Active trace.
Method
- Make the trace on which to fit a line the Active Trace. Do this by right-clicking on the trace and clicking Activate Trace.
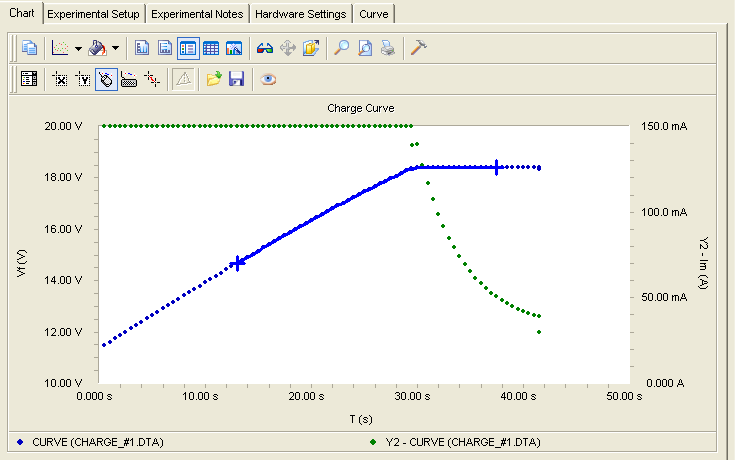
- Select a region on this trace using the Select Portion of Curve tool
 . To use this tool, left-click with the mouse close to one bounding point of the region. Next, left-click again near the second bounding point of the region. The region becomes highlighted. To re-select a region, toggle the Select Portion of Curve tool, and try again.
- After a region is selected, choose the Linear Fit command on the document menu. The algorithm now begins to fit a line to the selected region. When the fit is complete, a new trace is added to the chart.

- View the equation for the new line by moving the mouse cursor over the line and watching the tool-tip.
The Line 1 trace is listed as the Baseline. The Baseline is the line to or from which certain calculations are performed, such as Peak Height. When you Mark Peaks and a Baseline is present, the peak height is shown with respect to the Baseline.

Comments are closed.