Average
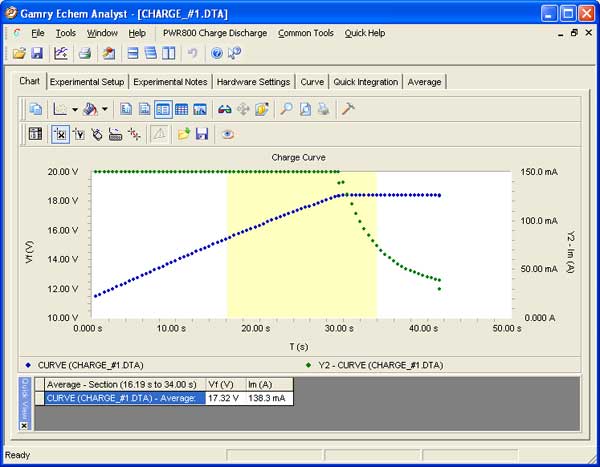
The Average command determines the average value for all or a selected portion of the data plotted on the y-axis. If you selected a region of the curve using the Select X Region tool, then the command calculates the average of the values within the selected region only. The command operates on all visible traces, and the results are placed on a new Average page, assuming one does not already exist. If this page already exists, the new information overwrites the old information.
Procedure
- If the calculation is to be based on only part of the curve, select the appropriate portion using the Select X Region tool.
- Once the desired portion of the curve is selected, select Average from the document window. As soon as you select this command, the computer begins to calculate the average y-values for each visible trace.

- Results are presented both on their own page, and in the QuickView area at the bottom of the chart. You can hide the QuickView window by clicking the X on the side-bar of the QuickView.

Comments are closed.