Total Harmonic Distortion (THD)
Similarities between Electrochemical Impedance Spectroscopy (EIS) and THD
THD is generally similar to EIS. A sinusoidal AC signal (galvanostatic or potentiostatic) is applied to an electrochemical cell, and the frequency is varied over time. The excitation signal Et can be expressed as a function of time t:
Et (ω) = E0 sin(ωt)[Eq. 1]
where E0 is the amplitude of the excitation signal and ω is the radial frequency. The radial frequency can be expressed using frequency f as follows:
ω = 2πf[Eq. 2]
The measured signal (if linear), gives a response, It, also sinusoidal with a different amplitude than I0 and shifted in phase ϕ:
It (ω)=I0 sin(ωt + ϕ)[Eq. 3]
The impedance Z(ω) at a given frequency can be then calculated using following formula (analogous to Ohm’s Law), where Z is the magnitude:

Differences between EIS and THD
Equation 4 is only valid if the measured system is linear. However, electrochemical systems are generally not linear. In case of EIS, we can assume pseudo-linearity by applying only a small AC amplitude. Nevertheless, EIS does ignore all non-linear portions of a measured signal.
In contrast, THD does provide information about the non-linear behavior of an electrochemical system. To obtain this information, Gamry Framework™ software applies a Fast Fourier-Transform, and the measured signal is displayed in its frequency domain as an FFT spectrum. The amplitude is plotted versus the frequency.
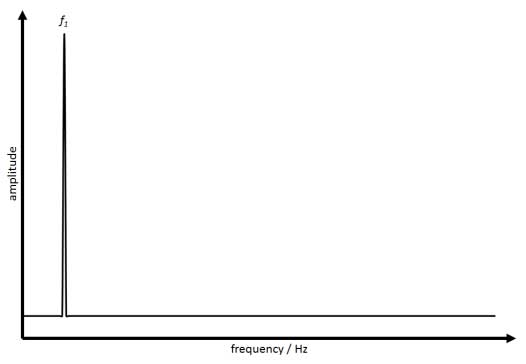
Figure 1 shows the FFT spectrum of a linear sine-wave signal. The spectrum shows a single peak at the fundamental frequency f1 of the applied sinusoidal signal.

Figure 1. FFT spectrum of a linear signal.
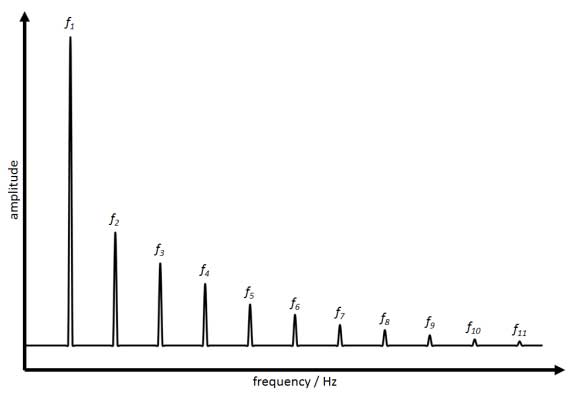
Figure 2 shows the FFT spectrum of a sinusoidal signal which is non-linear. A larger peak appears at the fundamental frequency f1 of the sine-wave signal. Additional peaks appear at integral multiples of the fundamental frequency f2 = 2f1, f3 = 3f1, f4 = 4f1, etc.). These peaks are called harmonics and represent the non-linear behavior of a signal. The amplitudes of the harmonics increase the more non-linear a system is.

Figure 2. FFT spectrum of a non-linear signal.
During THD, a THD factor is calculated for each frequency. It describes the ratio between the root mean squares of the harmonics (typically up to the 10th harmonic) and the amplitude of the fundamental frequency. The general equation for the THD factor is as follows:

The THD factor is then plotted versus the frequency in a double-logarithmic plot similar to the Bode diagram in EIS. The larger the THD factor, the more non-linear the system is.
The Take-away
THD allows analysis of non-linear behavior of an electrochemical system which cannot be done with EIS.
A Note on Application
THD requires the filter to be set so as to not distort the 10th harmonic, meaning a higher than usual filter will be utilized. This may allow additional noise into the measurement.
We recommend only turning on THD calculations at 1kHz or below on Interface family instruments, or at or below 100Hz on Reference family instruments.

Comments are closed.