Model 1–A Purely Capacitive Coating
A metal covered with an undamaged coating generally has a very high impedance. The equivalent circuit for a scenario like this includes a resistor (primarily caused by the electrolyte) and the coating capacitance in series.

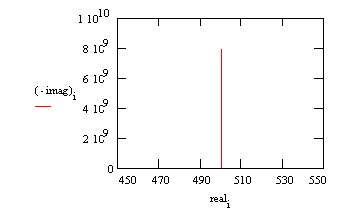
A Nyquist plot for this model is shown below. In making this plot, the following values were assigned:
R = 500 Ω (a bit high but realistic for a poorly conductive solution)
C = 200 pF (realistic for a 1 cm² sample, a 25 µm coating, and εr= 6)
Fi = 0.1 Hz (lowest scan frequency, a bit higher than typical)
Ff = 100 kHz (highest scan frequency)
Typical Nyquist Plot for an Excellent Coating

The value of the capacitance cannot be determined from the Nyquist plot. It can be determined by a curve fit or from an examination of the data points. Notice that the intercept of the curve with the real axis gives an estimate of the solution resistance.
The highest impedance on this graph is close to 1010 Ω. This is close to the limit of measurement of most EIS systems.
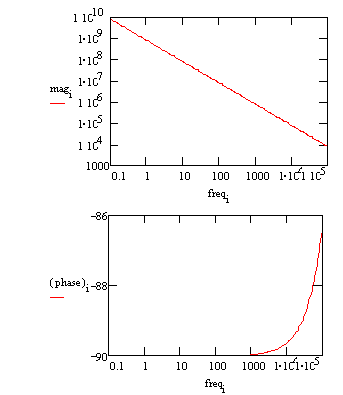
The same data can be shown in a Bode plot.

The capacitance can be estimated from the graph but the solution resistance value does not appear on the chart. Even at 100 kHz, the impedance of the coating is higher than the solution resistance.
Water uptake into the film is usually a fairly slow process. It can be measured by taking EIS spectra at set time intervals. An increase in the film capacitance can be attributed to water uptake.

Comments are closed.