Model 2–Randles Cell
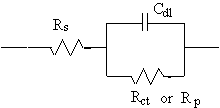
The Randles cell is one of the simplest and most common cell models. It includes a solution resistance, a double-layer capacitor and a charge-transfer or polarization resistance. In addition to being a useful model in its own right, the Randles cell model is often the starting point for other, more complex, models.

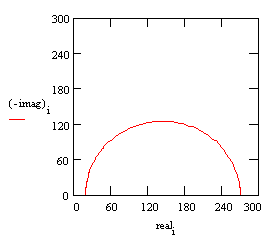
The following figure is the Nyquist plot for a typical Randles cell. The parameters in this plot were calculated assuming a 1 cm² electrode undergoing uniform corrosion at a rate of 1 mm/year. Reasonable assumptions were made for the β coefficients, metal density and equivalent weight. The polarization resistance under these conditions calculated out to 250 Ω. A capacitance of 40 mF/cm² and a solution resistance of 20 Ω were also assumed.
Nyquist Plot for 1 mm/year Corrosion Rate

The Nyquist plot for a Randles cell is always a semicircle. You can find the solution resistance by reading the real-axis value at the high-frequency intercept. This is the intercept near the origin of the plot. This plot was generated assuming that Rs = 20 Ω and Rp= 250 Ω.
The real-axis value at the other (low-frequency) intercept is the sum of the polarization resistance and the solution resistance. The diameter of the semicircle is therefore equal to the polarization resistance (in this case 250 Ω).
The following figure is the Bode plot for the same cell. The solution resistance and the sum of the solution resistance and the polarization resistance can be read from the magnitude plot. The phase angle does not reach 90° as it would for a pure capacitive impedance. If the values for Rs and Rp were more widely separated, the phase would approach 90°.
Bode Plot for 1 mm/year Corrosion Rate
imagewmf00052_wmf.gif

Comments are closed.