Model 4–Coated Metal
The impedance behavior of a purely capacitive coating was discussed in Model 1. Most coatings degrade with time, resulting in more complex behavior.
After a certain amount of time, water penetrates into the coating and forms a new liquid/metal interface under the coating. Corrosion phenomena can occur at this new interface.
The impedance of coated metals has been very heavily studied. The interpretation of impedance data from failed coatings can be very complicated. Only a simple equivalent circuit is discussed here.

Even this simple model has been the cause of some controversy in the literature. Most researchers agree that this model can be used to evaluate the quality of a coating. However, they do not agree on the physical processes that create the equivalent-circuit elements. The discussion below is therefore only one of several interpretations of this model.
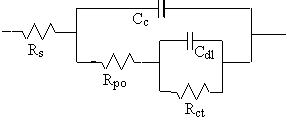
The capacitance of the intact coating is represented by Cc. Its value is much smaller than a typical double-layer capacitance. Its units are pF or nF, not mF. Rpo (pore resistance) is the resistance of ion-conducting paths that develop in the coating. These paths may not be physical pores filled with electrolyte.
On the metal side of the pore, we assume that an area of the coating has delaminated and a pocket filled with an electrolyte solution has formed. This electrolyte solution can be very different from the bulk solution outside of the coating. The interface between this pocket of solution and the bare metal is modeled as a double-layer capacitor in parallel with a kinetically controlled charge-transfer reaction.
When you use EIS to test a coating, you fit a data curve to this type of model. The fit estimates values for the model’s parameters, such as the pore resistance or the double-layer capacitance. You then use these parameters to evaluate the degree to which the coating has failed.
In order to show a realistic data curve, we need to do this operation in reverse. Assume that we have a 10 cm² sample of metal coated with a 12 µm film and that we have five delaminated areas. 1% of the total metal area is delaminated. The pores in the film that access these delaminated areas are represented as solution-filled cylinders with a diameter of 30 µm.
The parameters used to develop the curves are shown below:
Cc = 4 nF; calculated for 10 cm² area , εr = 6, and thickness = 12 µm
Rpo = 3400 Ω; calculated assuming k = 0.01 S/cm
Cdl = 4 µF; calculated for 1% of 10 cm² area and assuming 40 µF/cm²
Rct = 2500 Ω; calculated for 1% of 10 cm² area and using polarization resistance assumptions from an earlier discussion
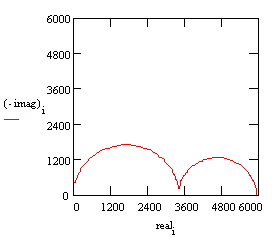
With these parameters, the Nyquist plot for this model shows that there are two well-defined time constants.

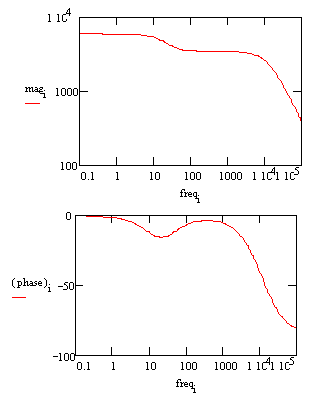
In a Bode plot representing the same data, the two time constants are visible but less pronounced.

The Bode plot does not go high enough in frequency to measure the solution resistance. In practice this is not a problem, because the solution resistance is a property of the test solution and the test cell geometry, not a property of the coating. Therefore, it is usually not very interesting when you are testing coatings.

Comments are closed.