Important but Little-used Analyst Buttons
Disable Axes Autoscaling button 
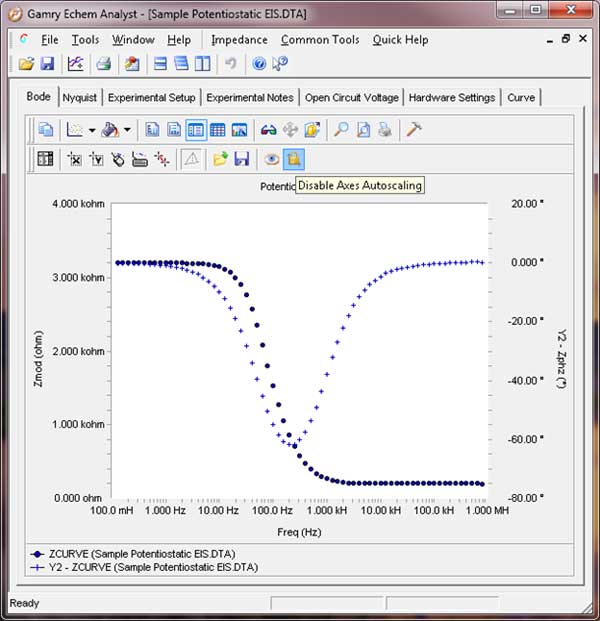
When selected, this button locks Analyst plot settings.
When not selected, the plot scaling changes every time a data file is overlaid, points are enabled or disabled, or a model is fit to the data. This can get very annoying.
NOTE: We recommend you disable axes autoscaling before any manual scaling operation.
Copy to Clipboard button 

This button copies the current chart to the Windows® clipboard. You typically save the plot as a bitmap and paste the plot into a program like Microsoft Word®. If you control the graph scaling carefully, you can easily get report-worthy plots.
Properties… button 
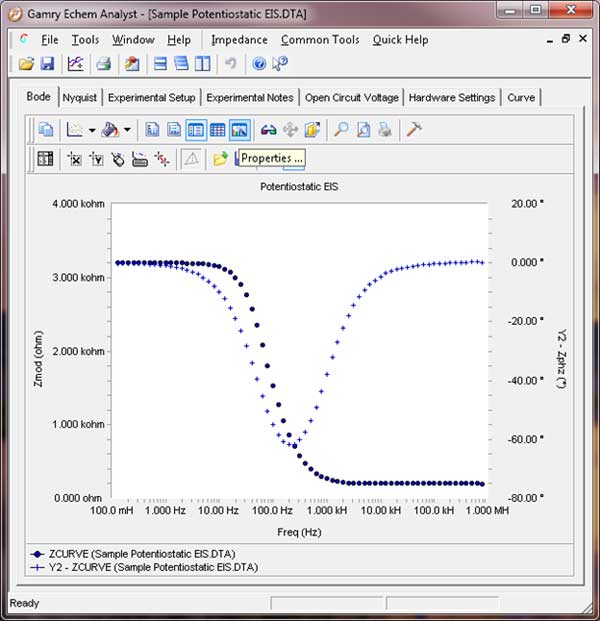
This button allows you to scale the graph shown in the Echem Analyst™. The Axes tab is particularly useful. Use it to select the range of data displayed on an axis and the ticks on the axis. For example, you can choose the y-axis to range from –2.0 to +12.0, with labels every 1.0 and tick marks every 0.25. Axes, Details… also chooses linear or logarithmic display format.
Overlay Data button 
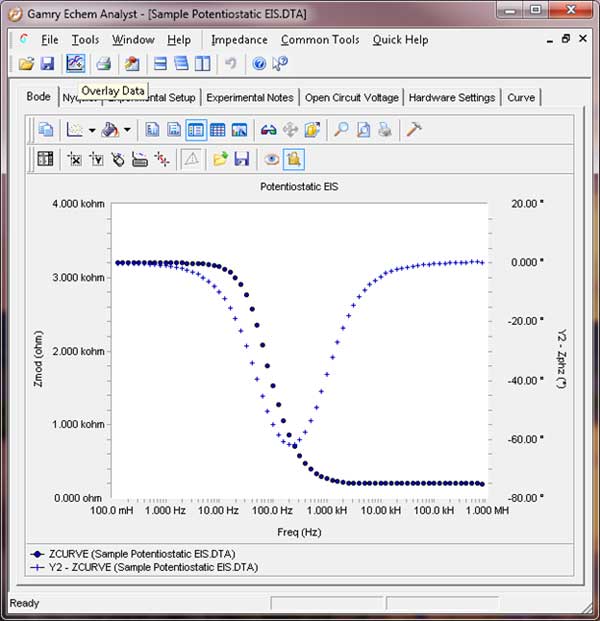
Use this button to add a data set to an existing graph. If you have already altered the graph settings, we recommend disabling axes autoscaling before adding data.
Comments are closed.