Description
Parameter |
Description |
Units |
||
|---|---|---|---|---|
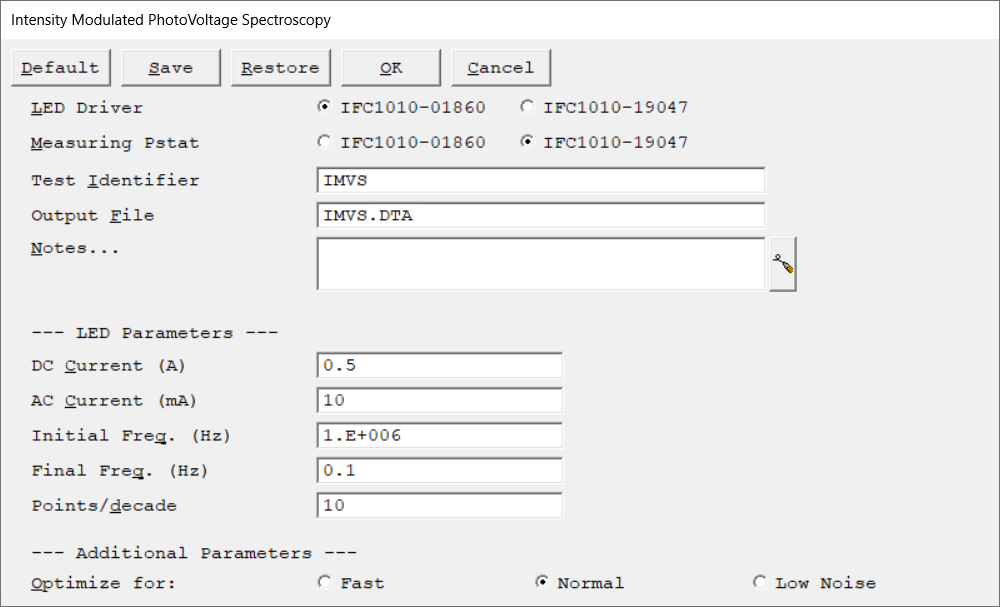
Select the potentiostat to control the LED. Each radio button corresponds to an installed potentiostat. You can select only one potentiostat at a time. Potentiostats that are already in use are marked with an asterisk. They can be selected but cannot be used. LED Driver (MASTER) and Cell Pstat (SERF) must be configured as a bi-potentiostat.
|
|
|||
Select the potentiostat/galvanostat to perform the experiment. Each radio button corresponds to an installed potentiostat. You can select only one potentiostat at a time. Potentiostats that are already in use are marked with an asterisk. They can be selected but cannot be used. LED Driver (MASTER) and Cell Pstat (SERF) must be configured as bi-potentiostat.
|
|
|||
A string that is used as a name. It is written to the data file, so it can be used to identify the data in database or data manipulation programs. The Identifier string defaults to a name derived from the technique's name. While this makes an acceptable curve label, it does not generate a unique descriptive label for a data set. The Identifier string is limited to 80 characters. It can include almost any normally printable character. Numbers, upper- and lower-case letters, and the most common punctuation characters including spaces are valid. |
|
|||
The name of the file in which the output data are written. By default, it is saved in the default file directory.
|
|
|||
Enter several lines of text that describe the experiment. A typical use of Notes is to record the experimental conditions for a data set.
Notes defaults to an empty string and is limited to 400 characters. It can include all printable characters including numbers, upper- and lower-case letters, and the most common punctuation including spaces. Tab characters are not allowed in the Notes string. Press the Notes button on the right-hand side to open a separate Notes dialog box. |
|
|||
The constant current applied to the LED. The DC Current is summed with the AC Current.
|
amperes (A) |
|||
The amplitude of the AC signal applied to the LED. Multiply the entered root-mean-square (rms) value by √2 (or ~1.414) to convert into a peak value. The range of the AC Current is determined by the DC current and the upper current limit of the LED. Generally, all LEDs provided by Gamry can handle up to 1 A.
|
mA rms |
|||
The starting frequency of the frequency sweep during data acquisition.
|
hertz (Hz) |
|||
The final frequency of the frequency sweep during data acquisition.
|
hertz (Hz) |
|||
The data density of the measured impedance spectrum. The data are spaced logarithmically and the number of data points in each frequency decade equals Points/decade. As a consequence, the frequency sweep may not stop exactly at the final frequency. It is guaranteed to do so only when the scan range contains an integer number of decades, such as 5 kHz to 0.05 Hz (five decades). You can use Initial Freq., Final Freq., and Points/decade to calculate the total number of data points in the spectrum.
|
|
|||
Select the sampling method for the experiment: •Fast is the appropriate selection when the cell's stability is poor and a spectrum must be measured rapidly, or the system's impedance is low and well defined. •Normal is the appropriate selection when the cell's impedance is high or the electrochemical system is noisy. •The best data can be taken with Low Noise, but the time required to record an EIS spectrum can be quite long.
|
|

