Discontinuities in EIS Spectra
What does a Discontinuity Look Like?
Spectra collected using Gamry Instruments’ EIS scripts will occasionally show discontinuities. They are small, abrupt deviations in impedance phase and magnitude in the spectrum. This Help page describes these discontinuities, explains their causes, and helps you eliminate them from your data.
The plot below shows plot of a poor-quality EIS spectrum recorded on a 2 kΩ resistor cell. The instrument was a Gamry Instruments Interface™ 1010 potentiostat and the AC signal was 10 mVrms. The ideal spectrum has zero phase and a modulus of exactly 2000.0 Ω. The phase in this spectrum has a very apparent discontinuity at 30 kHz. The maximum phase error was 442 millidegrees.
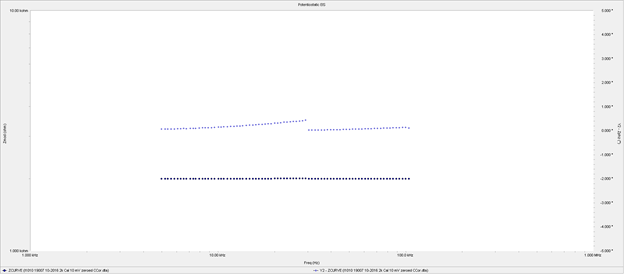
As frequency increases, you see gradual increase in phase error followed by a sharp return to the correct value. This is typical of discontinuities that occur when an instrument’s settings change between data points acquired in a spectrum. The impedance points below 30 kHz were recorded on the instrument’s 10 µA current range and those above 30 kHz were recorded on the 100 µA current range.
NOTE: This spectrum was recorded using the worst cell cable we could find in our laboratory. Don’t panic—below we tell you how to eliminate the error.
What Causes this Type of Discontinuity?
A discontinuity can occur whenever an instrument setting changes. The settings that can change during spectrum acquisition include:
- Current range
- A/D and signal-processing changes in gain
- Filter-frequency changes
Each of these will be discussed below.
Why do Changes in Current Range Cause Discontinuities?
Gamry Instruments’ potentiostats use a circuit topology with the Working electrode connected to ground through a current-range resistor. The stray capacitance between the Working electrode and ground is in parallel with the current measurement resistor, Rm.
This produces frequency-dependent error because some of AC cell current does not flow through Rm. The effect of stray working lead capacitance depends strongly on the resistance used to measure the cell current. Lower-value resistors have less error.
One source of stray capacitance across Rm is in the cell cable that connects your Gamry Instruments potentiostat to the electrochemical cell. Different cables have slightly different working-lead capacitance. The differences come from manufacturing variations in the coaxial cable and small variations in the geometry of the cable terminations. The spectrum of the 2 kΩ resistive cell (shown above) used a very poor cable.
Cable-Capacitance Correction
Revision 7.06 of Gamry Instruments’ Software Suite (and EIS software) adds a new EIS correction that can eliminate EIS discontinuities caused by cell-cable capacitance. See Cable Capacitance Correction and Calibrate Cable Capacitance for details.
Other Sources of Work Lead-to-Ground Capacitance
Capacitance is seen whenever two conductors at different potentials get near each other. Faraday cages can create problems with capacitance. To avoid Working electrode-to-ground capacitance, the Working electrode and its cell leads must be kept away from the walls of the faraday cage. If you are testing the capacitance of a barrier coating, avoid cell arrangements that have the working electrode directly adjacent to the walls of floor of your faraday cage. Maintain a gap of at least 1 cm (more is better) between the working lead and the faraday cage. Avoid other metal apparatus (for example, a heater) near the Working electrode.
Discontinuities from A/D Gain Switching
You can also get EIS glitches when the A/D signal-processing channel changes gain. Gamry Instruments potentiostats generally have three or four A/D ranges for measuring potential and current. One example is the Interface™ 1010’s V channel which has these ranges: 30 mV, 300 mV, 3 V, and 12 V full-scale.
GamryInstruments’ EIS software has corrections that eliminate glitches caused by A/D gain switching. Each instrument should be calibrated to measure the values used in these corrections. In some instruments, this is done during the AC Cal portion of the Calibrate Instrument procedure. In other instruments the calibration is done at the factory.
Discontinuities from Changes in Filter-Frequency
Another source of discontinuities is changes in A/D channel filter frequencies. Gamry Instruments potentiostats have multiple analog filters in front of the A/D converters. The filter’s cut-off frequency is chosen to be appropriate for the EIS frequency being measured. The switching frequencies are currently 2.5 Hz, 500 Hz, 5 kHz, and 100 kHz.
Gamry Instruments’ EIS software includes corrections to deal with variation in the AC characteristics of these filters. In some instruments, this is done during the AC Cal portion of Calibrate Instrument. In other instruments the calibration is done at the factory.
If you see discontinuities at the filter-switching frequencies, re-run AC Calibration if it is available for your instrument. In most cases this makes the errors smaller.
Comments are closed.